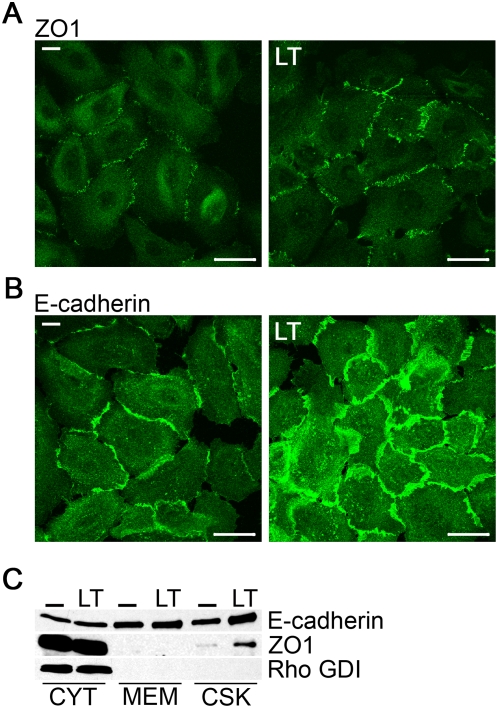
Figure 2. Junction proteins are elevated after LT treatment.
(A, B) NHBE cells were treated with or without LT for 48 h and stained with ZO1 (A) or E-cadherin (B). Confocal images were taken consecutively. Scale bar represents 50 µm. (C) Fractionation of LT-treated and untreated (-) NHBE cells into cytosol (CYT), membrane (MEM) and cytoskeletal (CSK) fractions. Immunoblotting was performed using anti-E-cadherin and anti-ZO1. Rho GDI served as cytosol marker.

