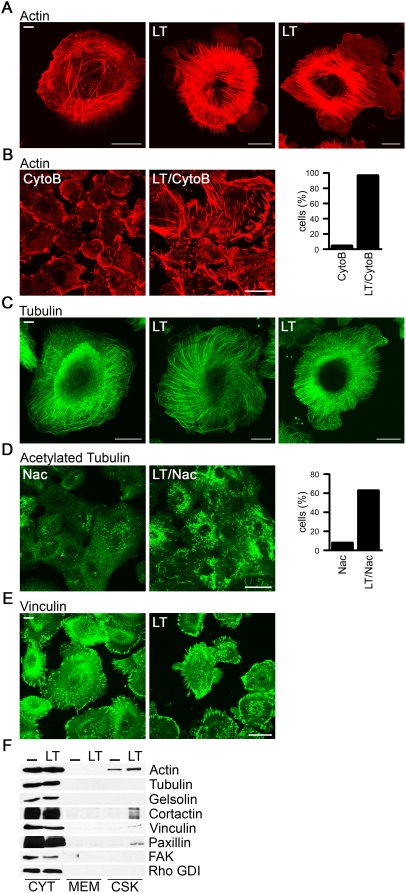
Figure 3. LT induces stress fiber formation and stabilized microtubules.
(A, C) Immunofluorescence images of NHBE cells with or without LT treatment (48 h). Cells were stained for actin (A, red) or α-tubulin (C, green). Scale bar represents 20 µm. (B, D) Cells with or without LT treatment were incubated for 1 h with 1 µg/ml cytochalasin B (CytoB) (B) or 10 nM nacodazole (Nac) (D) and stained for actin (red, B) or acetylated tubulin (D, green). Scale bar represents 50 µm. Remaining actin stress fibers (B) or stable microtubules (D) were quantified in 500 cells/per condition. (E) Confocal images of NHBE cells treated with or without LT and stained with vinculin (green). Scale bar represents 50 µm. (F) Fractionation of LT-treated and untreated (-) NHBE cells into cytosol (CYT), membrane (MEM) and cytoskeletal (CSK) fractions. Immunoblotting was performed using the indicated antibodies. Rho GDI served as cytosol marker.

