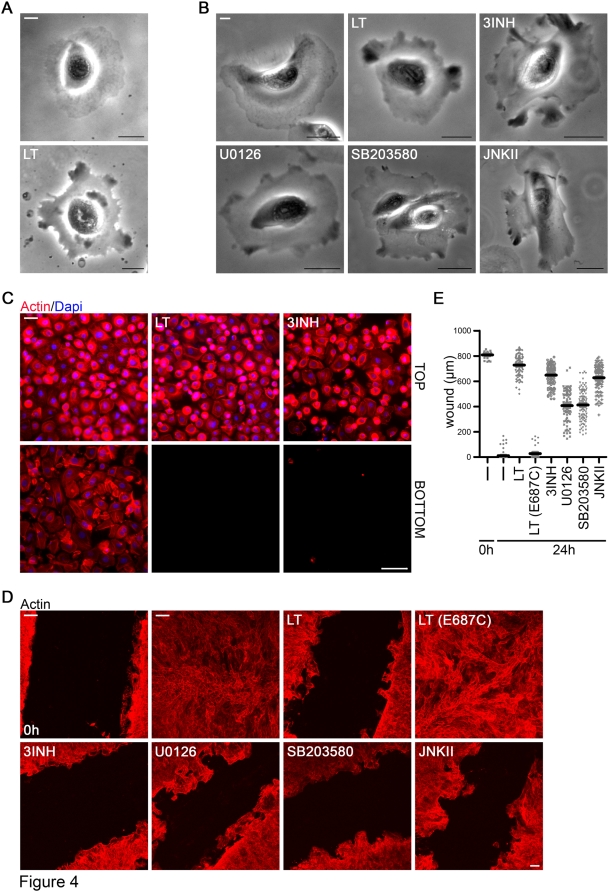
Figure 4. LT mediates polarization and motility defects in airway cells.
(A) A representative frame of bright field live cell movies of untreated and LT-treated NHBE (48 h) after global growth factor stimulation (see Methods). Scale bar represents 20 µm. The complete movies (Movie S1 untreated and Movie S2 LT-treated) are in Supplemental data. (B) One representative frame of bright field live cell movies of untreated (-), LT-treated (48 h) or MKK/MAPK inhibitor-treated (48 h) NHBE cells after global growth factor stimulation (see Methods). Scale bar represents 20 µm. The corresponding movies (S3–8) can be found in the Supplemental part. (C) Chemotaxis of untreated (-), LT-treated (48 h) or MKK/MAPK inhibitor-treated (48 h) NHBE in Boyden chambers. 3INH is a combination of three inhibitors (U0126, SB203580, JNKII). Cells were stained with rhodamine phalloidin (red) and DAPI (blue). Upper panels depict cells on the top of the membrane after 1 h of plating before growth factors were added to the bottom chamber. The lower panels show cells on the bottom of the filter 21 h after addition of growth factors. Scale bar represents 50 µm. (D) Immunofluorescence imaging of wound healing assay using polarized NHBE (actin, red). Untreated (-) 0 h image displays the original scratch, whereas all other images were taken 24 h later. Cells were left untreated or treated with LT, catalytically inactive LT (E687C), 3INH combination, or inhibitors for MKK1/2 (U0126), p38 (SB203580) or JNK (JNKII) for 48 h before the scratch was performed. Scale bar represents 100 µm. (E) Quantification of experiment shown in (D). Data (mean+/−SEM) are represented as width of the wound of 4–8 different areas with 2 inserts/condition. The overall analysis of variance between all groups was highly significant: F6,604 = 675.4, p<0.0001.

