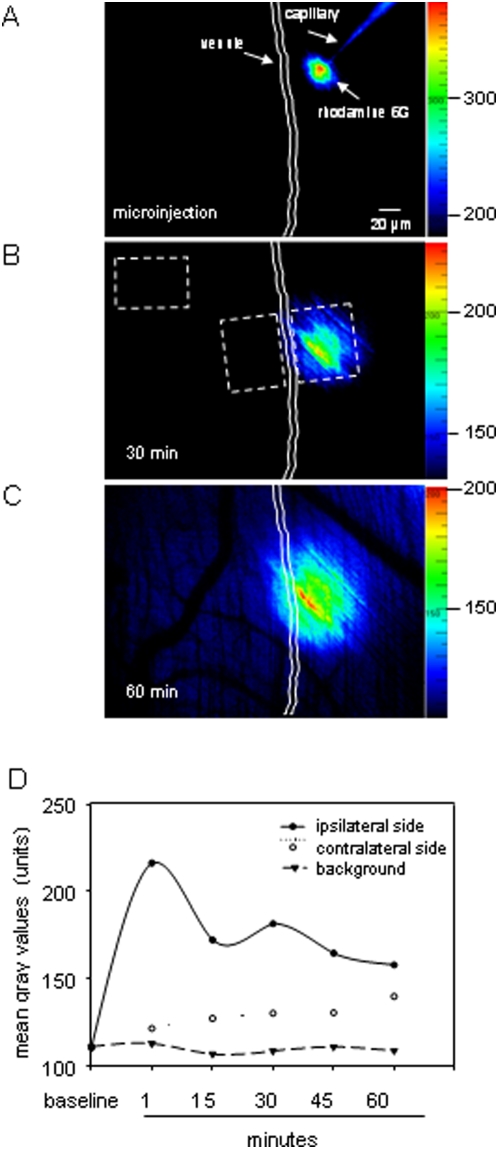
Figure 2. Tissue distribution of rhodamine 6G after microinjection.
A-C: In vivo microscopy images show tissue distribution of rhodamine 6G at 1 (A), 30 (B), and 60 min after microinjection (C). Three regions of interests 100×75 µm (depicted in B) within the cremasteric interstitial tissue were analyzed: on the vessel side ipsilateral to the microinjection site, on the contralateral side, and in the interstitial tissue at a distance of 350 µm from the site of microinjection (considered as background). Images are shown with different original color scales to emphasize the fluorescent intensity within 60 min after microinjection. The fluorescence intensity was determined within 60 min; the quantitative data are presented in D; n = 7.

