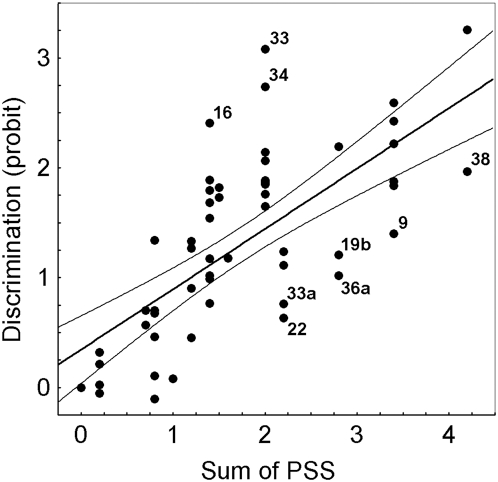
Figure 10. Linear regression between discrimination scores (ordinate) and the sum of position salience scores (PSS, abscissa) as calculated with the linear model applying calculation 1 (all signals are learned independently, see text).
The discrimination scores (probit) result from converting the percentage of correct choices for each of the two alternative patterns into probit values and subtracting these probit values. The PSS for position 1 is set to 1.0, that of position 2 to .7, that of position 3 to .4, and that of position 4 to .1 (calculation 1, see text). Pearson correlation: P<0.0001, r2 = 0.49. The data points marked with the numbers of the respective experiments (see table 1) indicate outliers (selected by eye); numbers 16, 33 and 34 for experiments in which discrimination appears to be better than expected from the model calculation, numbers 9, 19b, 22, 33a, 36, 38 for experiments in which the discrimination scores appear to be lower than expected from the model calculation (see text). The thin lines show 95% confidence range.

