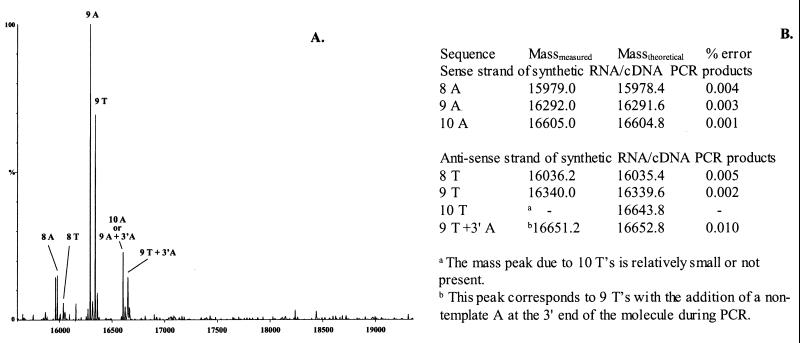
Figure 5.
(A) Mass spectrum of PCR products generated from the cDNA template derived from synthetic RNA. The molecular mass is shown on the x axis, and the relative intensity of the signal is indicated on the y axis. Two single-strand products are present for each PCR fragment. The number of A or T residues in the homopolymeric run is shown above each peak. (B) Tabulation of the measured and predicted masses of the PCR product single strands. The difference between predicted and measured masses is expressed as the percentage error for each peak.

