
Figure 2.
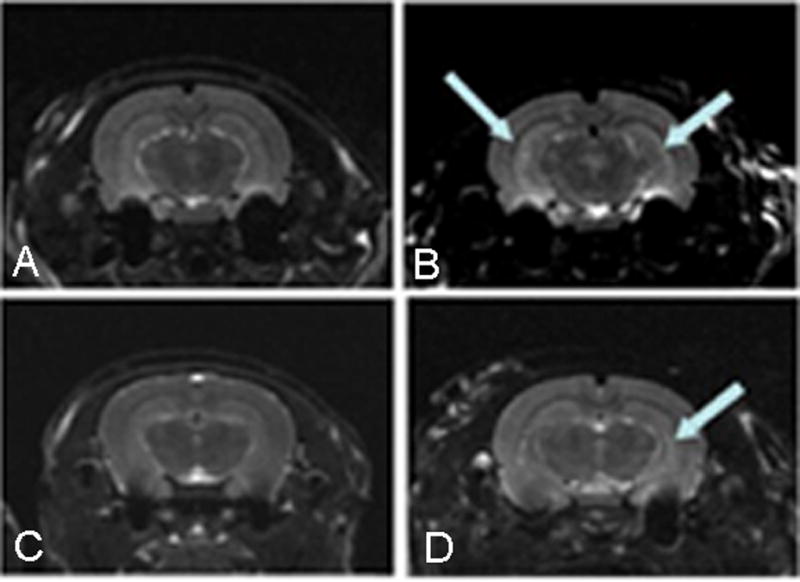
T2-weighted magnetic resonance images of two control (A,C) and two rats that sustained EFS (B,D), one month after the seizures. T2-weighted images were acquired using a 7 Tesla magnet (see methods for further details). Increased T2 signal intensities in both hippocampi are apparent in one of the EFS rats (B)(arrows, top right) and were quantified by calculating T2 relaxation time values on a pixel-by-pixel basis. A more asymmetrical increase of T2 signal was apparent in a second EFS rat (D) (arrow, bottom right), compared to littermate control rats (Top and bottom left panels).