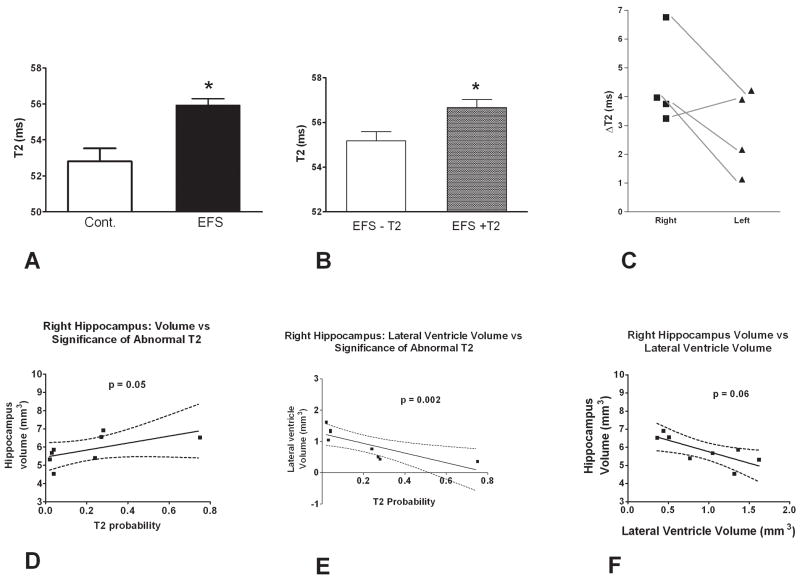
Figure 3.
Effects of EFS on MRI absolute T2 relaxation times (ms) and volume changes in hippocampus and lateral ventricles. (A) Absolute hippocampal T2 values of controls (n = 10) and of rats that had experienced experimental prolonged febrile seizures (n = 8). Seizures were induced on postnatal day 10, and rats were imagined a month later. T2 values of the EFS rats as a group were significantly higher than those of controls (p = 0.025). (B). EFS rats segregated into two groups, with significantly different T2 values in the hippocampus and other regions. T2 values of T2-positive rats (n = 4), were significantly higher than those of control as well as the values of the T2-negative group (p = 0.03). The T2 values of the negative group were not significantly different from the controls. (C) Asymmetry of increased T2 values in EFS experiencing rats. The difference between raw T2 values in the right or left hippocampus of a T2-positive rat and the mean values of the controls (ΔT2) are plotted (see Methods). The presence of this asymmetry and the preponderance of right hippocampal changes are apparent. (D) An inverse correlation of the volume of the hippocampi involved in abnormal T2 signal and the volume of the ipsilateral ventricle was found in the EFS group (n = 8).). (E) A correlation of hippocampal volume and the absolute MRI T2 values demonstrates a strong association of increased T2 signal with a reduction in the volume of the involved hippocampus in individual rats with EFS. (F) Correlation of the ventricular volume ipsilateral to a T2-positive hippocampus of individual rats experiencing EFS, with the T2 signal values in the same hippocampus.

