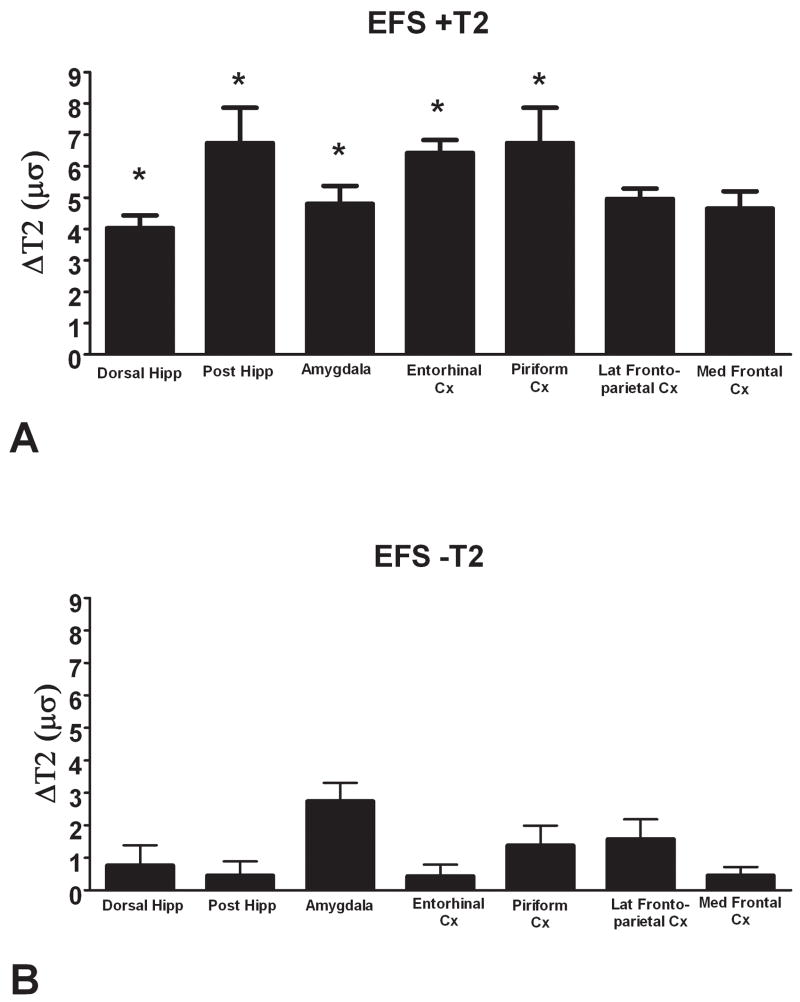
Figure 4.
Examples of T2 relaxation time values in limbic and non-limbic brain regions of “T2-positive” and “T2- negative” EPS rats (defined by hippocampal signal changes, see text). (A) An example of an EPS rat with significant elevation of hippocampal T2 values: “EFS #15 (+T2)”. Significant elevation of T2 values occurred throughout the limbic circuit of this rat (* = p < 0.05), but not in ‘the ventral posterior thalamus, an ‘extra-limbic’ region. (B) T2 values on MRI of an EPS rat with no significant change in hippocampal T2 values “EFS # 11 (−T2)”. Note the absence of significant T2 increase in most of the limbic structures. Hipp = hippocampus, Cx = cortex, VPM Thal = ventral posterior-medial nucleus of the thalamus. Values are presented as the difference between raw T2 values in the structure of interest of an individual EFS rat and the mean values of the control values for the same structure (ΔT2), all in the right hemisphere (see Methods).

