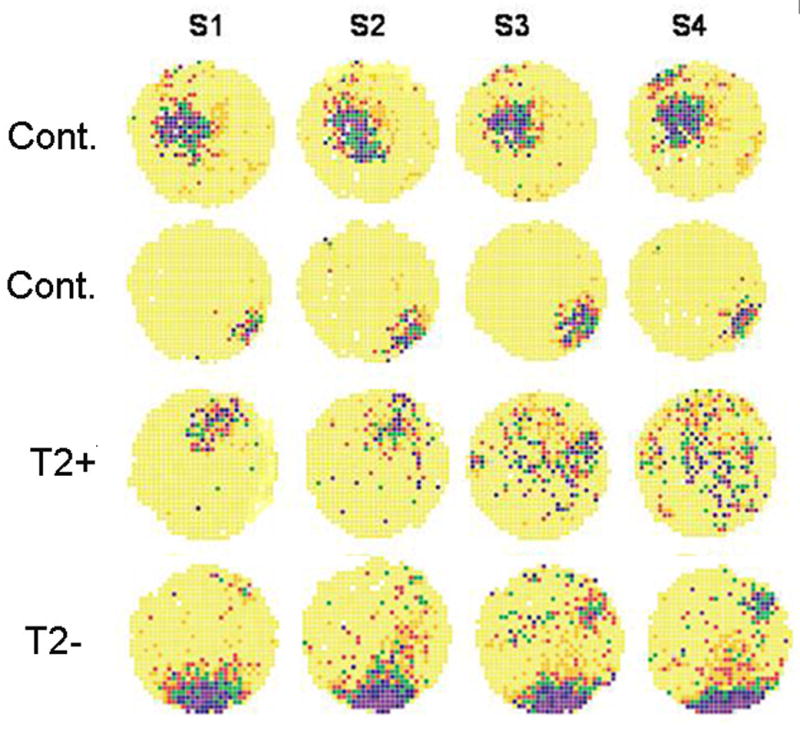
Figure 8.

Examples of place cell stability. Each row is from four different rats. The first two rows are from control rats while the third row is from an EFS rat without T2 signal changes and the fourth row from a rat with T2 signal changes. Note the change in place cell field across sessions in the rat with the T2 signal changes. Coherences of the place cell field for the first session were (0.69, 0.75, 0.45, and 0.69, respectively from the top to bottom row).
