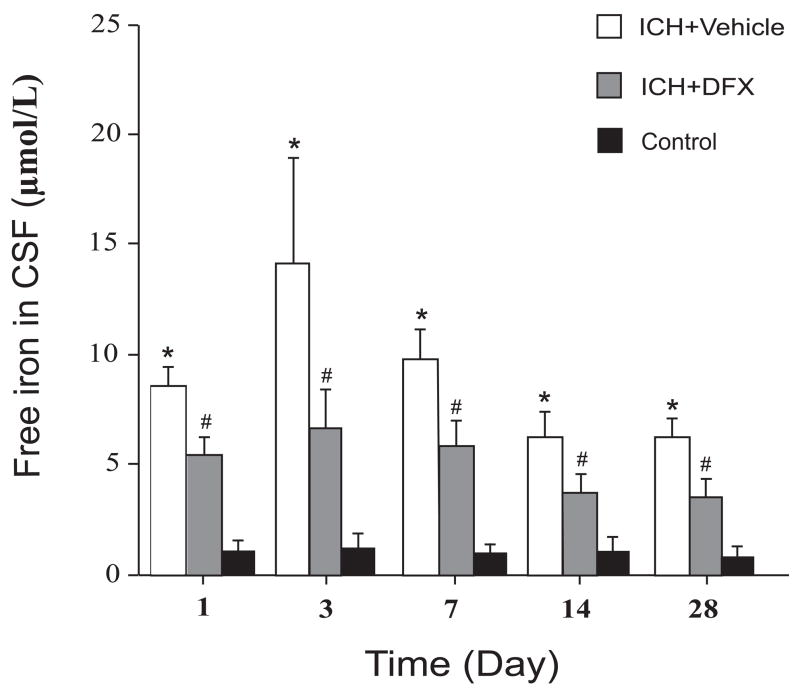
Figure 5.
Bar graph showing the time course of free iron levels in CSF after intracerebral infusion of autologous blood and the effect of deferoxamine treatment on the free iron levels in CSF after intracerebral infusion of autologous blood. Values are expressed as means ± SD. * p<0.01 between ICH+Vehicle group and the Control group, # p <0.05 between DFX-treated group and the vehicle-treated group.

