
Fig. 2.
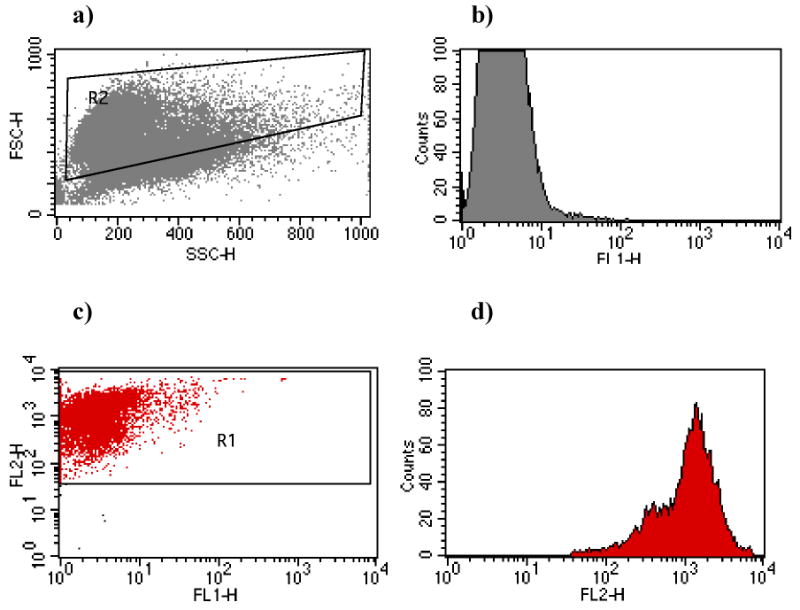
Flow cytometric measurements of host cells alone. a) Dot plot of forward (FSC) and side (SSC) scatter of unlabeled U937 cells. Gate R2 was designed for the single color assay to include as many eukaryotic cells as possible. b) Histogram plot showing the level of green fluorescence (FL1) in U937 cells without added bacteria. c) Dot plot of FL1 vs. FL2 (red fluorescence) of PKH-labeled U937 cells. Gate R1 contains the red fluorescent cells as in the dual color assay. d) Histogram plot of these labeled U937 cells showing the level of red fluorescence.