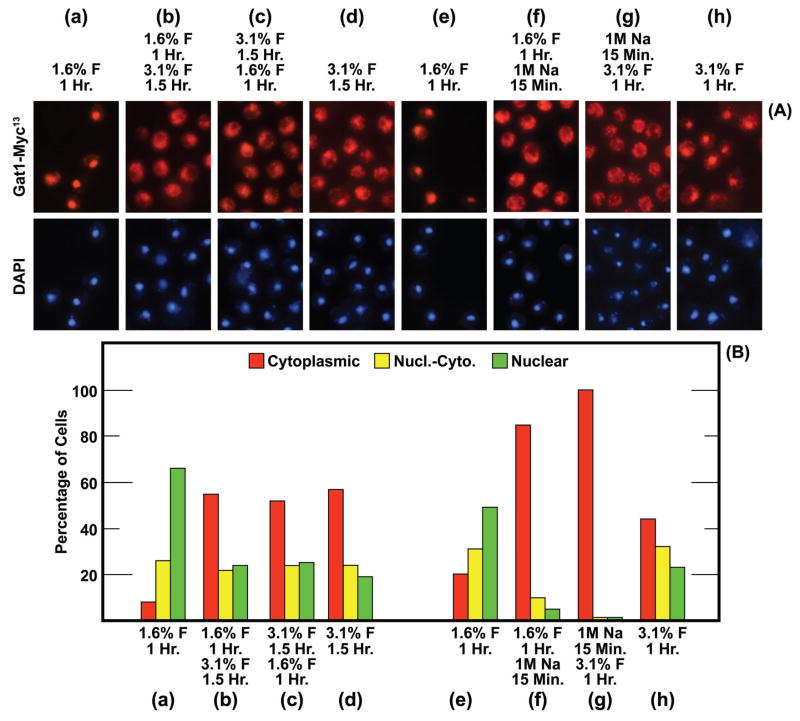
FIG. 5.
Gat1-Myc13 is not completely immobilized even after 1 hr of fixation with 1.6% formalin. The experimental format is indicated above each pair of images (a)-(h), and below each histogram (a)-(h). The concentration of formalin is indicated as % F with the time of the initial treatment immediately below it. Below that is the final concentration of formalin that existed during the second round of fixation and below that value, the time of that second fixation. For example, the format in (b) was fixation for 1 Hr with 1.6% formalin (final concentration) followed by an additional 1.5 Hr fixation with 3.1% formalin (final concentration. In (f) cells were treated with 1 M NaCl (1 M Na, final concentration) for 15 min in place of the second round of formalin fixation. In (g) 1 M NaCl (final concentration) was substituted for the first round of formalin fixation. The strain used in these experiments was FV063.

