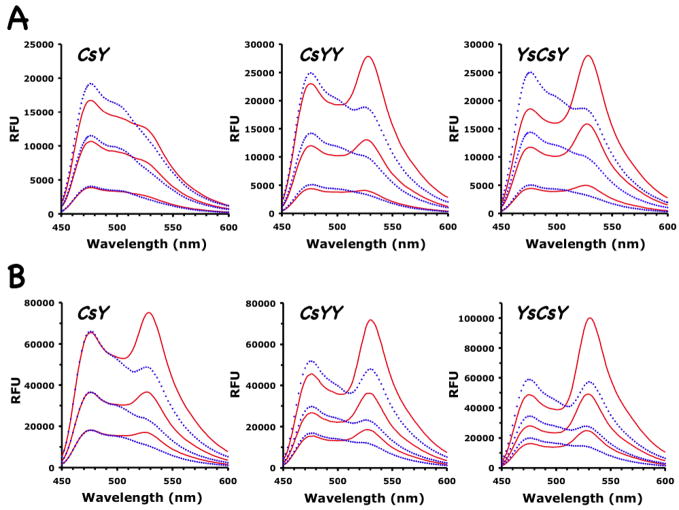
Figure 2.
Emission scans of three FRET substrates, CsY, CsYY and YsCsY. Spectra before (solid red lines) and after (dotted blue lines) treatment with BoNT/A-LC were recorded at 30°C using excitation at 420 nm with (A) 10 μM Zn2+ and increasing substrate concentrations of 1, 3 or 5 μM, or (B) 300 μM Zn2+ and increasing substrate concentrations of 2.5, 5 and 10 μM.

