Figure 3.
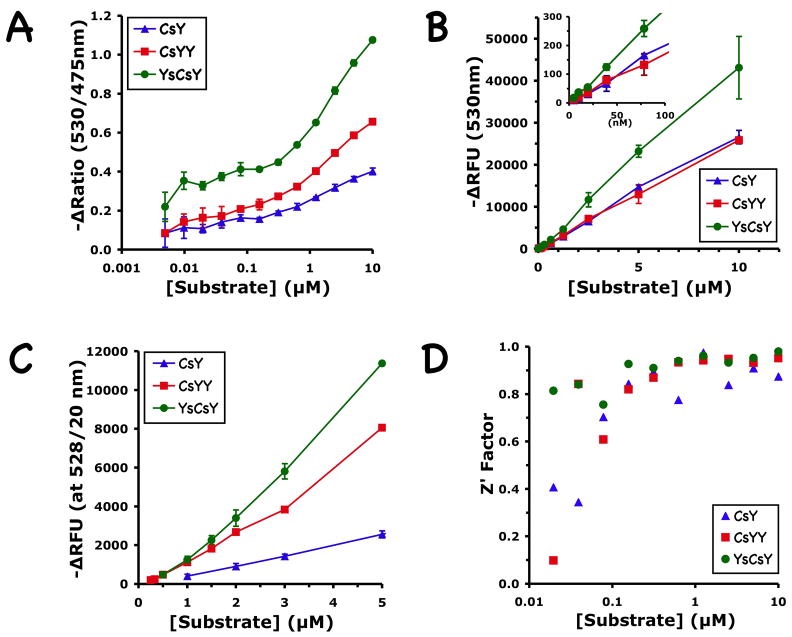
Concentration dependence of ratiometric and fluorometric changes in CsY, CsYY and YsCsY. (A) Change of fluorescence ratio at 530 nm versus 475 nm calculated from full monochromatic scans with excitation at 420 nm, recorded at 30°C in reaction buffer containing 300 μM of Zn2+ before and after BoNT/A-LC-catalyzed cleavage. Shown are the averages of three repeats for each data point. (B) Change of fluorescence at 530 nm calculated from the same scans as in (A). Inset shows the magnification of the same graph in the low substrate concentration region. (C) Change of fluorescence at 530 nm recorded in filter mode (528/20 nm) at 30°C and 10 μM of Zn2+. Shown are the averages of 3 repeats performed in triplicate, except for CsYY, where the two highest points were from a single triplicate measurement. (D) Z′ Factor calculated for the ratiometric assay in (B), using the equation: as defined by Zhang et al. (1999), μe, μc, σe,and σc are the means (μ) and standard deviations(σ)of experimental (e) and control (c) measurements. CsY, blue triangles; CsYY, red squares; YsCsY, green circles.

