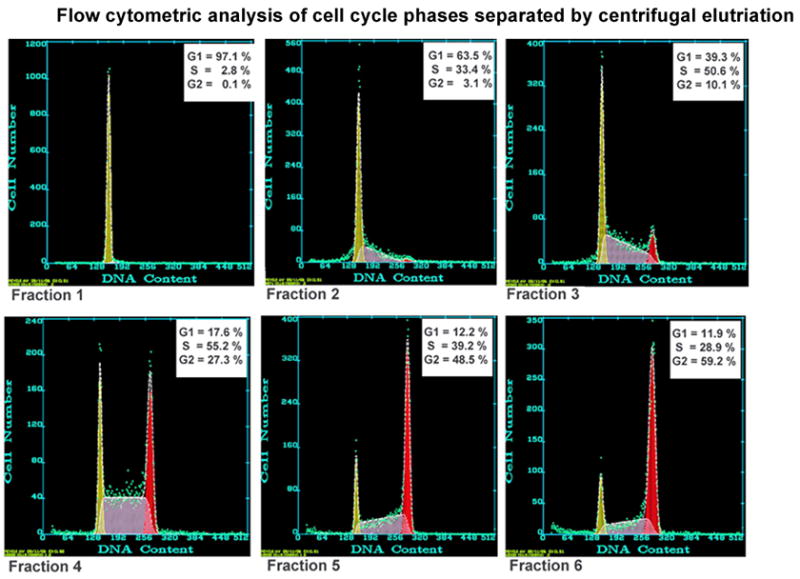
Figure 1. Flow cytometric analysis of cell cycle phases separated by a typical centrifugal elutriation.

Verification of cell cycle phase distribution for each elutriation trial was accomplished by propidium iodide staining followed by detection using a Beckman/Coulter EPICS Elite flow cytometer. The resulting data was analyzed by Multicycle software (Phoenix Flow Systems) and reported as the percentage of cells in G1, S, or G2/M phase. This is a representative profile demonstrating 6 sequential fractions recovered from a single elutriation run. Enriched fractions for G1, S and G2/M were selected for subsequent experiments.
