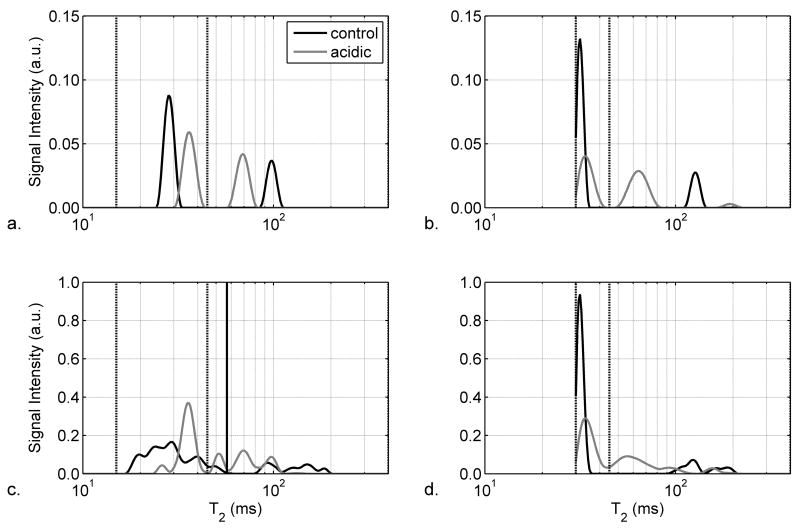
Figure 4.
Semi-log plots of T2 spectra from representative (Panels a and b) and summed (Panels c and d; n=7) non-localized acquisitions with echo spacings of 2 ms (Panels a and c) and 8 ms (Panels b and d). As indicated in the legend to Panel a, the data are shown for control muscles (black lines) and acidic muscles (gray lines). In order to highlight the muscle region of the T2 spectrum, the region from 10–400 ms is shown. The vertical dashed lines indicate the boundaries of the intracellular T2 component, as discussed in the text.

