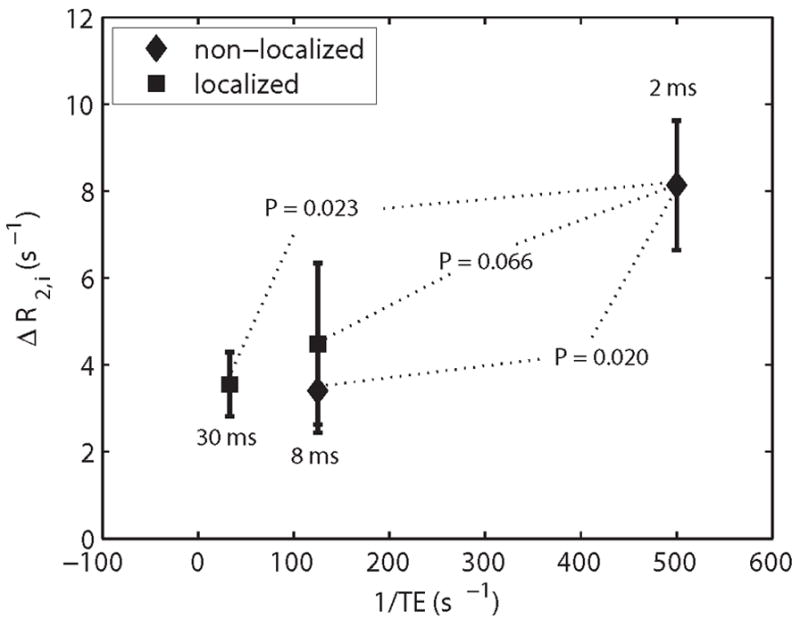
Figure 5.

The differences in R2,i (ΔR2,i) between acidic and control muscles are plotted as a function of the refocusing rate for the non-localized and localized experiments. The error bars represent the standard error of the mean. In both cases, localized and non-localized, as the echo spacing time is decreased, ΔR2,i becomes larger. The P values reported are relative to the shortest TE of 2 ms.
