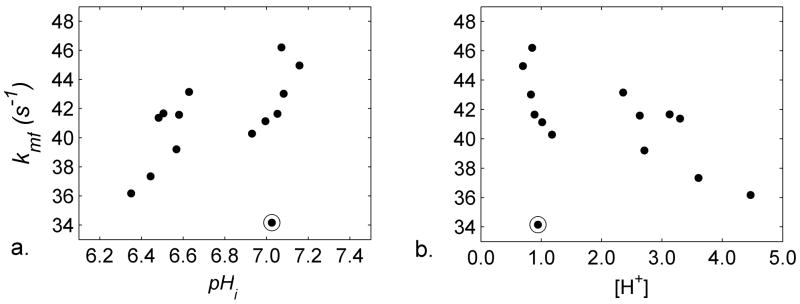
Figure 7.
Scatterplots illustrating relationships among pH and kmf parameters. a) Plot of kmf as a function of pHi. The circled point was identified as an outlier and so the data from it and its acidic muscle pair were removed from all descriptive and inferential statistical tests involving the MT parameters. b) Plot of kmf as a function of [H+].

