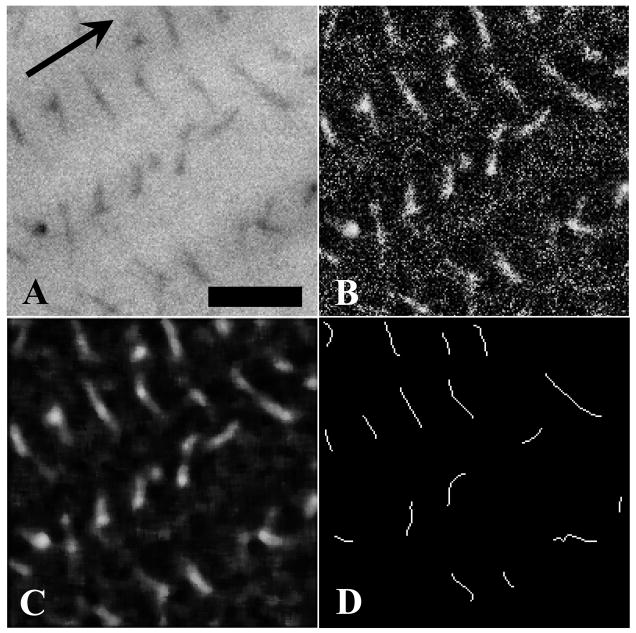
Figure 2.
Demonstration of the improved image processing algorithm used to isolate sulfated GAGs in TEM images. Panel A – Portion of sample image with sulfated GAGs stained against a grayscale collagen background (arrow denotes collagen axis). Panel B – Local grayscale equalization filtering. Panel C – Median filtering of equalized image. Panel D – Wire frame representation used to calculate orientation of stained GAGs. Branched wire frame objects were broken and only the longest continuous chain was retained. Size filtering was applied to remove detected GAGs below a critical length (10 pixels). Bar = 50 nm.

