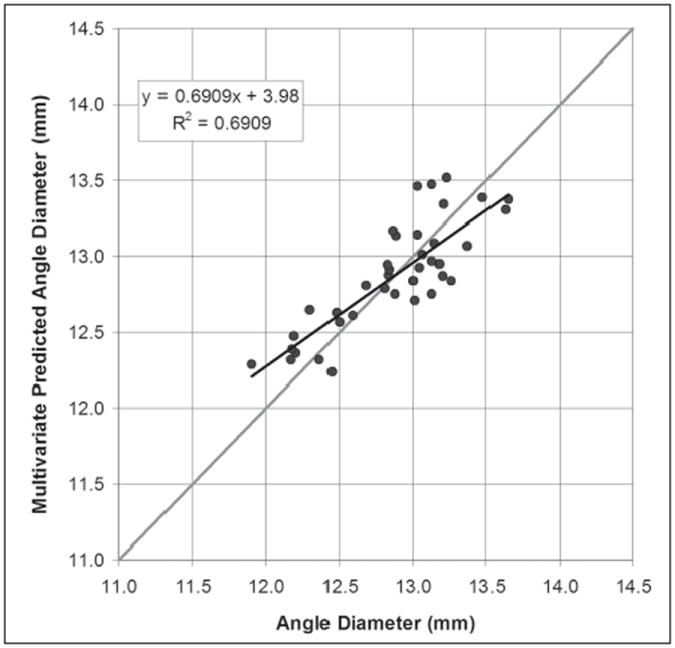
Figure 3.

Scatterplot of the Artemis direct measurement of angle diameter against the angle diameter value predicted by the multivariate regression Eq.(2). The regression line is plotted as a continuous black line and the regression equation and Pearson’s correlation coefficient are presented. The gray line represents equality.
