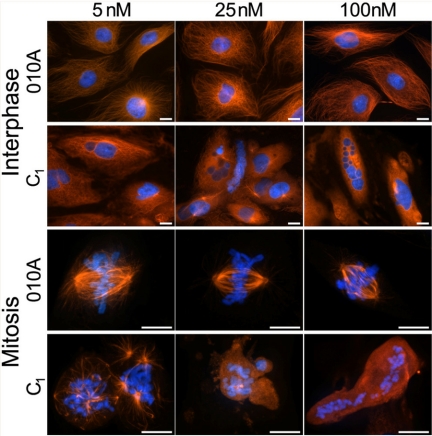
Fig. 4.
Disorazole C1 disrupts microtubules at interphase and metaphase. Mammalian PtK2 cells were treated with the indicated concentrations of either O1OA (inactive analog of disorazole C1) or disorazole C1 for 24 h at 37°C. Cells were fixed and stained with anti-α-tubulin antibody to visualize microtubules (red) and Hoechst 33342 to visualize chromosomes (blue). All images were collected with a Nikon E600 microscope (Nikon, Tokyo, Japan) equipped with a Roper CoolSnap HQ digital camera (Roper Scientific, Trenton, NJ) at 40× (interphase) or 100× (mitotic spindles) objectives. Top, interphase; bottom, mitosis. Bars, 10 μm.

