
FIGURE 5. Impairment of synaptic transmission in the trpml.
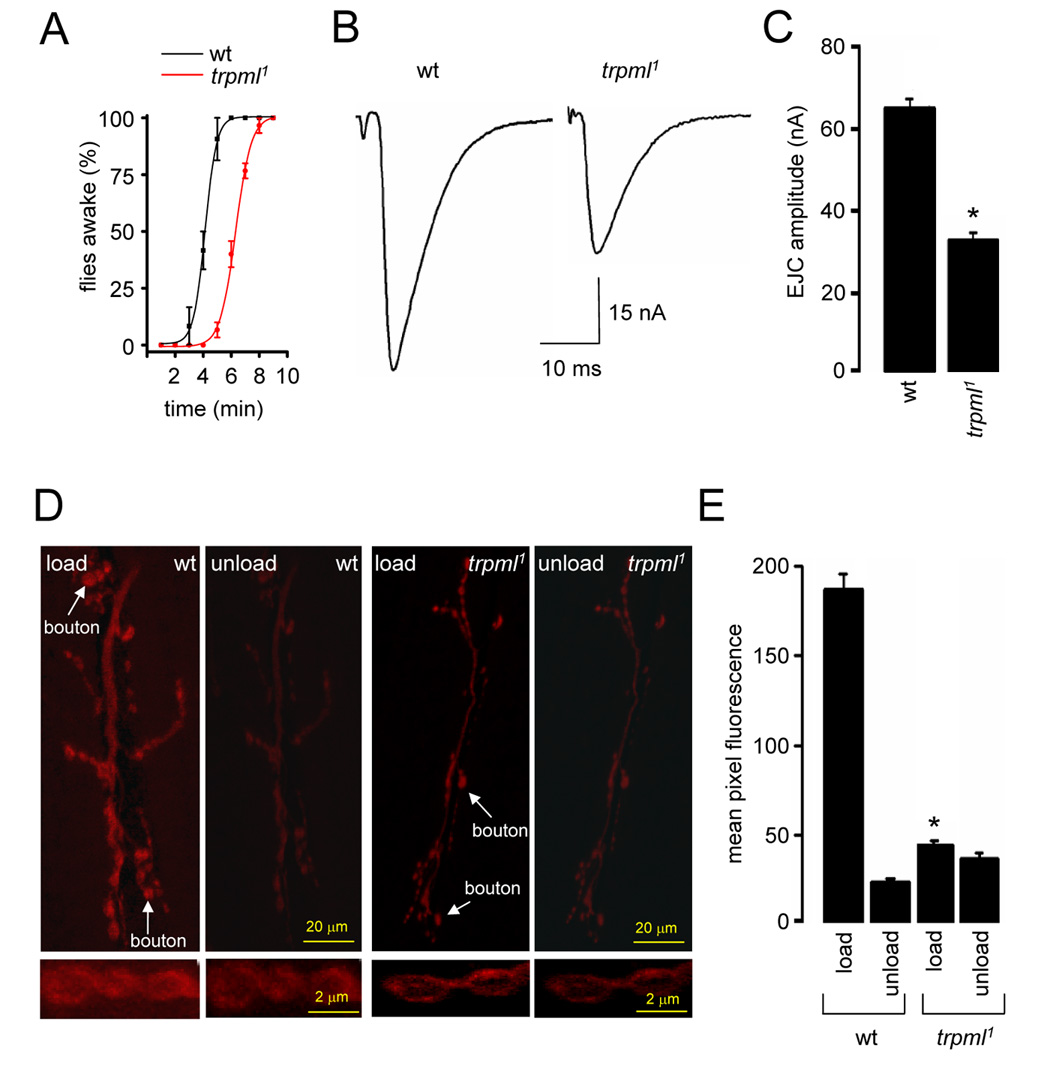
(A) Time-course of flies with restored mobility following a 3 min exposure to CO2. n=3, 10 flies per experiment.
(B) Excitatory junctional current (EJC) from the 3rd instar NMJ.
(C) Quantification of the EJC amplitudes in wt and trpml1. n=5 animals; 10 NMJs for each genotype; *, p≤0.001.
(D) NMJ synapses following FM1-43 loading and unloading. Arrows indicate synaptic boutons. Panels below show enlarged magnification of synaptic boutons.
(E) Quantification of FM1-43 fluorescence intensity in NMJ boutons following dye loading and unloading. n=5 animals,10 NMJs for each genotype; *, difference from wt, p≤0.001.
All statistical analyses, t-test.