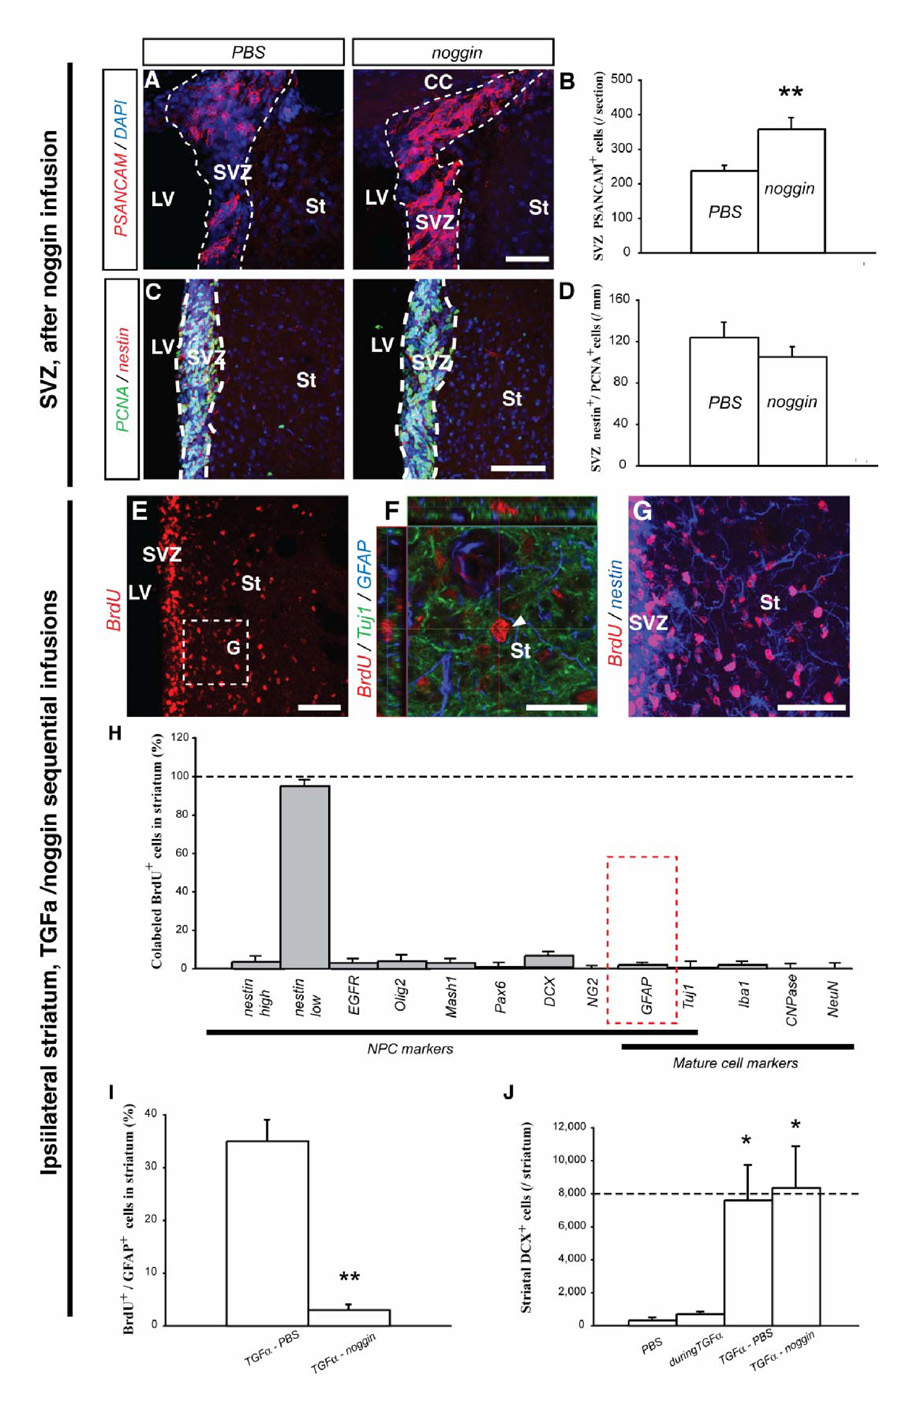
Figure 5. Phenotypes of striatal newborn cells in the rat striatum after TGFα and noggin sequential infusions.
(A–D) Increased SVZ neurogenesis after noggin infusion in the DA-depleted rat striatum. (A) PSANCAM+ cells in the SVZ of PBS (left panel) and noggin infused rats (right panel). (B) Cell counts revealed significantly more SVZ neuroblasts in rats treated with noggin than in rats treated with PBS (unpaired t test, p < 0.01). (C) PCNA+ and nestin+ profiles in PBS (left) and noggin infused rats (right). (D) Cell counts revealed similar numbers of nestin+/PCNA+ cells in the SVZ after PBS or noggin infusion. (E–J) Striatal fate of newborn cells after TGFα/noggin consecutive infusions. (E) Numerous BrdU+ cells (red) were detected in the ipsilateral striatum after TGFα and noggin sequential infusions. (F) Orthogonal projection of a striatal BrdU+ cell (red) that neither expressed Tuj1 (green), nor GFAP (blue). (G) Higher magnification image of the region in (E) showed that most striatal BrdU+ cells expressed nestin (blue). (H) Histogram comparing the percentage of marker-positive cells among striatal BrdU+ cells. (I) Histogram comparing the proportion of BrdU+ cells colabeled with GFAP, in rats sequentially infused with TGFα and then PBS, or TGFα and then noggin. (J) Mean striatal number of DCX+ neuroblasts per ipsilateral striatum in the 4 conditions. Scale bars: A, G, 50 µm; C, E, 100 µm; F, 25 µm.

