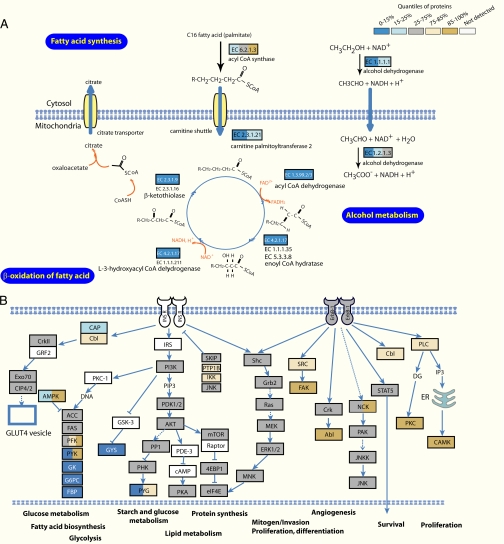
Fig. 5.
Phenotypic proteome comparison at the pathway level. A, mapping of protein ratios on the fatty acid metabolism pathway reveals that almost the entire module is down-regulated several-fold in Hepa1–6. Proteins are color-coded according to their relative expression in the two cell types according to the scheme in Fig. 2. B, KEGG pathway mapping of ErbB and PI3K signaling pathway shows that they are equally present in primary cells and the cell line. PI3K, phosphatidylinositol 3-kinase.

