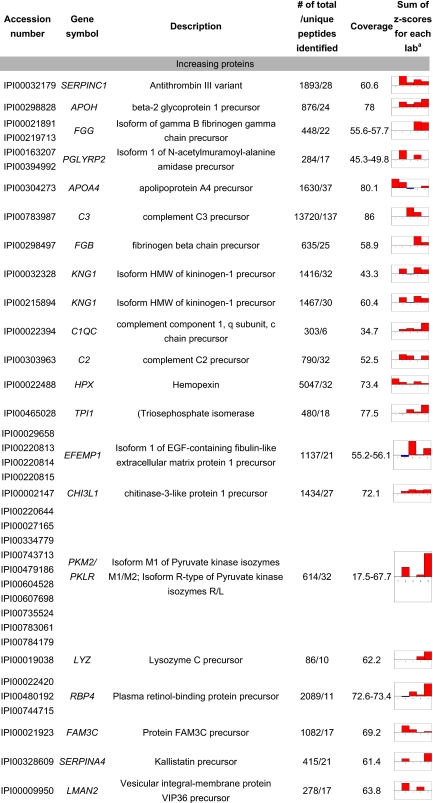
Table VI.
The most significantly changed proteins in CSF of HD-affected individuals compared with unaffected ones
Each bar in this column represents the sums of z-scores based on logarithm of early/control and mid/control ratios for each lab. The negative scores are plotted in blue, and the positive scores are in red.


