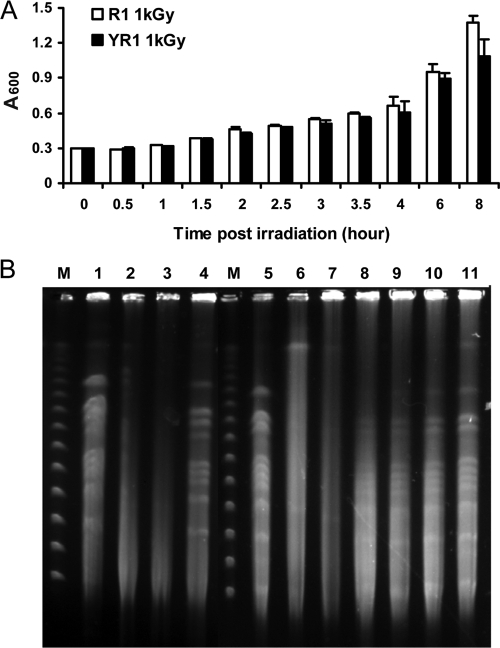
Fig. 1.
Cell growth and genome recovery after γ radiation. A, growth of D. radiodurans cultures for strains R1 (□) and YR1 (▪) after 1 kGy of γ radiation. Each data point represents an average of triplicate experiments and error bars represent standard deviations. B, genome recovery of wild type R1 and the pprI knock-out strain YR1 after exposure to irradiation. M, pulse field gel electrophoresis markers (New England Biolabs); lane 1, unirradiated R1, lanes 2–4, R1 postirradiation time 0, 45, and 90 min, respectively; lane 5, unirradiated YR1; lanes 6–11, R1 postirradiation time 0, 45, 90, 180, 270, and 360 min, respectively.

