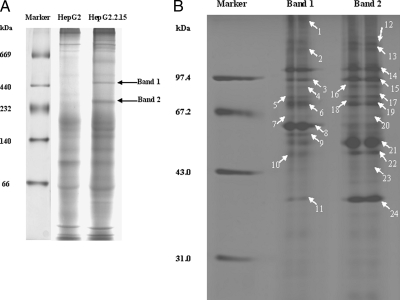
Fig. 1.
The difference of protein complexes between HepG2 and HepG2.2.15 cells. A, one-dimensional BN-PAGE proteomic map of whole cell lysates from HepG2 and HepG2.2.15 cells. Whole cell lysates were subjected to BN-PAGE, and the molecular mass markers are shown on the left. The gel was stained by Coomassie Brilliant Blue. Arrows represent the two distinct protein complexes that specially existed in HepG2.2.15 cells (Band 1 and Band 2). B, 2D BN/SDS-PAGE analysis of the two distinct protein complexes. Band 1 and Band 2 from the gel were excised, equilibrated, and separated by SDS-PAGE. Arrows represent successfully identified protein bands, and the corresponding numbers are shown in Table I.

