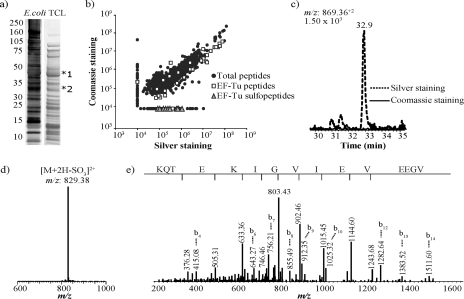
Fig. 5.
Identification of sulfopeptide artifacts from silver- and Coomassie Blue-stained gels of E. coli total cell lysate (TCL). a, silver- (left lane) and Coomassie Blue (right lane)-stained gels. b, scatter plot distribution of ion intensities for the peptides identified from silver- and Coomassie band-stained band 1 (shown in a). c, reconstructed ion chromatogram of m/z 869.36 from silver- and Coomassie Blue-stained gel bands. The m/z 869.36 ion was undetectable in the Coomassie Blue-stained sample. d, first generation (MS2) product ion spectrum of m/z 869.36. e, second generation (MS3) product ion spectrum of m/z 829.38 obtained from precursor m/z 869.36.

