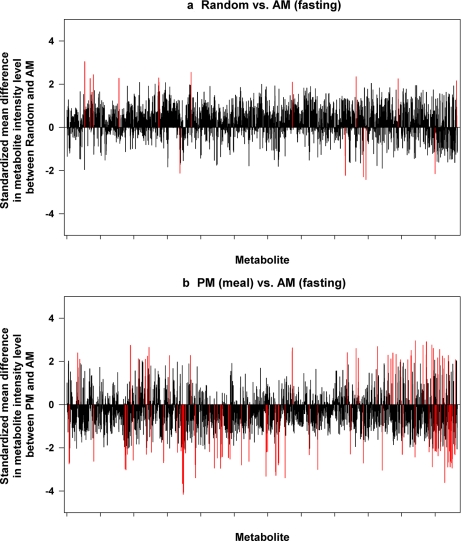
Fig. 2.
Comparisons of metabolomic spectra between varied times of day of urine collection. A first morning fasting sample (a.m.), a 30-min to 1-h postmeal sample (p.m.) on the same day, and a random sample taken irrespective of meals taken on a subsequent day (random) were obtained from normal subjects, and metabolites were analyzed by HILIC-MS. The standardized mean difference in intensity level for each of the metabolites (x axis) is shown on y axis. The red line represents the metabolites whose levels are significantly different between the two urine collection times.

