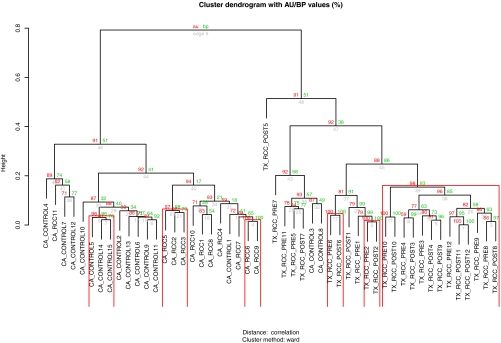
Fig. 3.
Urine metabolomic profiles segregate by cancer status and collection site but not operative status. Values on the edges of the clustering are p values (%). Red values are AU p values, which are computed by multiscale bootstrap resampling, and green values are bootstrap probability values, which are computed by normal bootstrap resampling. Clusters with AU larger than 95% are highlighted by rectangles and are strongly supported by data. Urines are labeled as follows: the first term refers to site of collection; the second is RCC versus control; the third is pre- (PRE) or postoperative (POST) (where indicated); and the fourth is patient number.

