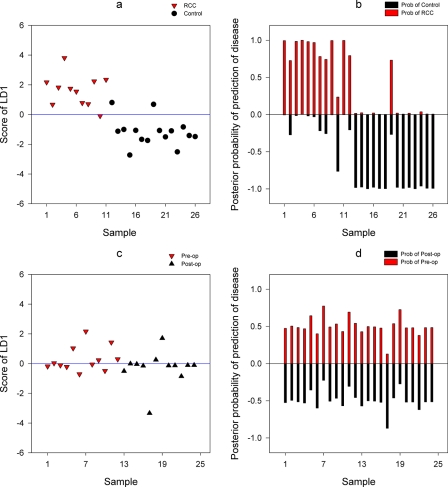
Fig. 5.
Prediction of group membership using LDA for the choice of k = 4. LDA analysis was performed on all samples for CA samples (a and b) and TX samples (c and d). The posterior probabilities for the groups are shown on the y axis. The absolute posterior probability is the probability of assigning a sample to each group. op, operative.

