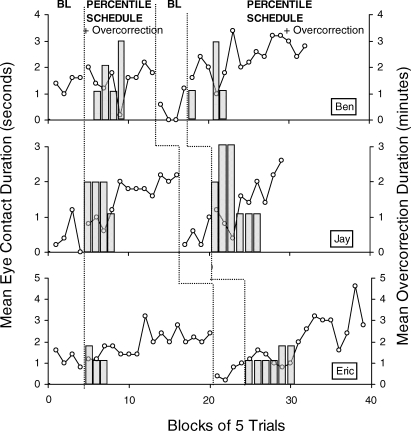
Figure 2.
Results for Ben, Jay, and Eric at baseline and in the percentile schedule plus overcorrection. Open circles indicate eye-contact duration (in seconds) plotted along the left y axis. Bars indicate duration of the overcorrection consequence (in minutes) plotted along the right y axis. Data points represent five-trial means.

