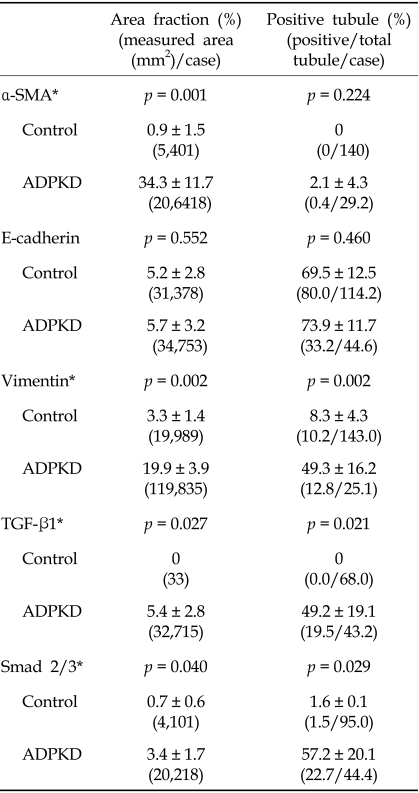
Table 1.
Immunohistochemical Results in Control and ADPKD by Morphometry Using a Color Image Analysis and Tubular Count
ADPKD, autosomal dominant polycystic kidney disease; α-SMA, α-smooth muscle actin; TGF-β1, transforming growth factor-β1.
Area fractions (%) are evaluated by color image analysis for 4 fields each specimen (× 200).
Positive tubules (%) are evaluated as percent of positive tubules/total tubules (× 200).
Data are shown as mean ± SD.
*p < 0.05.

