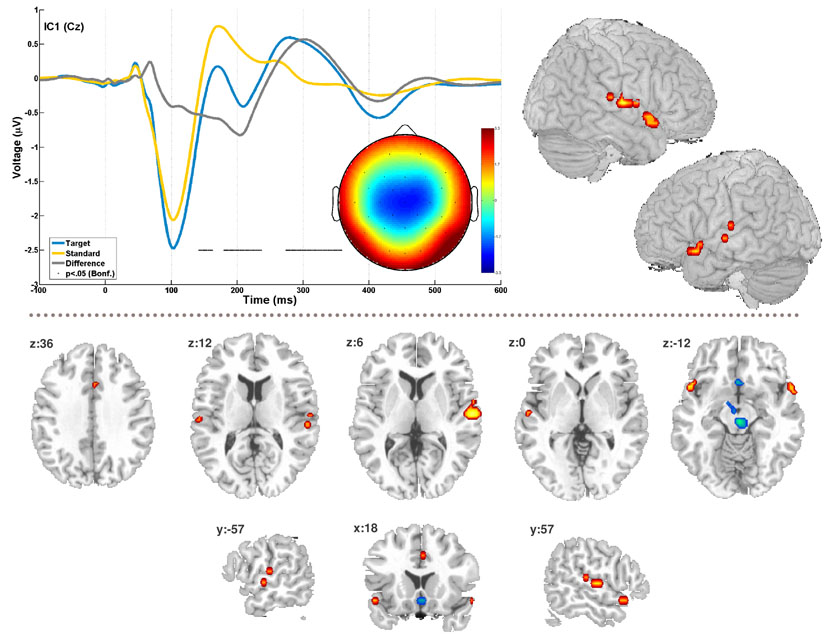
Figure 4. EEG-fMRI component.
The figure shows the timecourse and topography for EEG-tIC1 for standard and target epochs as well as the difference wave between them. The difference wave was subjected to pointwise one-sample t-tests, black dots indicate timeframes with significant difference from zero at p<‥05, Bonferroni corrected for 512 tests (t>6.93). The bilateral temporal activation in the correlated fMRI component is shown as a surface rendering (top right). Additional slices in the lower half illustrate the overall spatial pattern (see also table 1). The fMRI maps are thresholded at 1% false discovery rate, cluster extent 5 voxels. Positive correlation is plotted in red, inverse correlation in blue.

