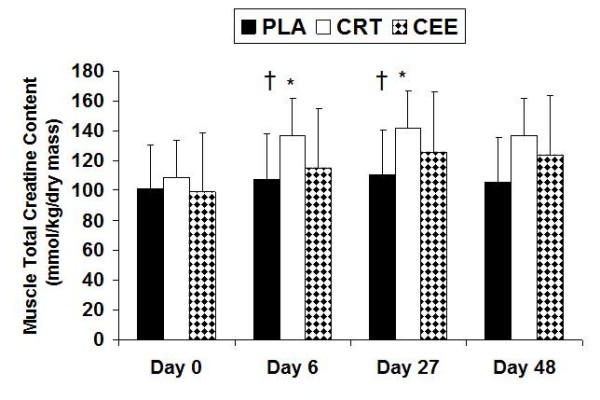
Figure 2.

Changes in muscle total creatine with data expressed as mean (± SD). † indicates a significant difference among groups where the PLA group was significantly less than the CRT (p = 0.026) and CEE (p = 0.041) groups. * indicates significant differences over the course of the four testing sessions where CRT increased at day 6 (p = 0.041) and 27 (p= 0.036), and CEE only increased at day 27 (p = 0.043).
