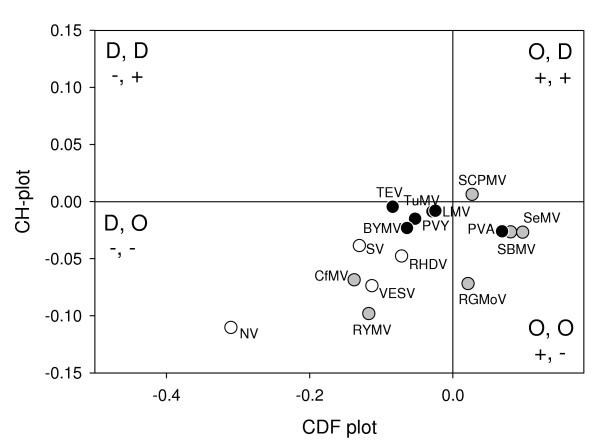
Figure 6.
Comparison of the PONDR® CDF and CH-plot analyses of whole protein order-disorder via distributions of VPgs within the CH-CDF phase space. Each spot represents a single VPg whose coordinates were calculated as a distance of this protein from the boundary in the corresponding CH-plot (Y-coordinate) and an average distance of the corresponding CDF curve from the boundary (X-coordinate). The four quadrants in the plot correspond to the following predictions: (-, -) proteins predicted to be disordered by CDF, but compact by CH-plot; (-, +) proteins predicted to be disordered by both methods; (+, -) contains ordered proteins; (+, +) includes proteins predicted to be disordered by CH-plot, but ordered by the CDF analysis. Open circles correspond to caliciviral VPgs, gray circles represent sobemoviral VPgs, whereas black circles correspond to potyviral VPgs.

