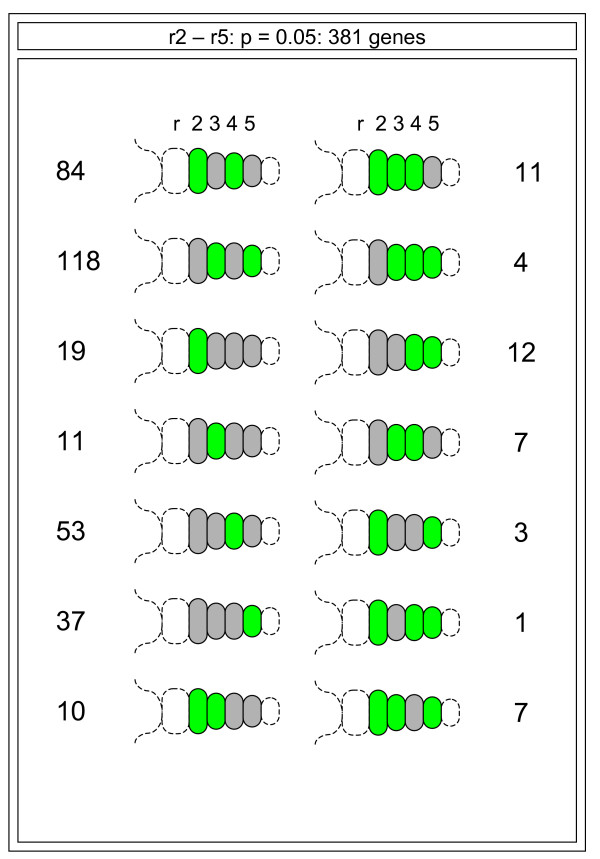
Figure 9.
Schematic diagram of an embryonic day 9.5 hindbrain showing all the variations in gene expression motifs. Green represents any rhombomere (r) where the expression of a gene is greater than its median across r2–r5 of the hindbrain. All possible combinations of gene expression and segmental motifs were seen, suggesting that hindbrain patterning is the summation of numerous segmentally regulated events. Variations in the numbers observed for each motif suggest the dominant mechanisms that drive hindbrain patterning.

