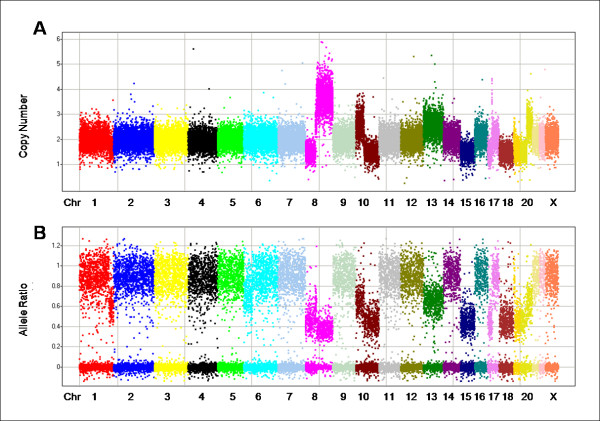
Figure 3.
Copy number (A) and allele ratio (B) data from the same tumor illustrating how the information can be used in concert to infer stromal contamination. In each panel, markers are arranged along the chromosomes and colored by chromosome. Chromosomes are typically labeled; some of the smaller chromosomes are unlabeled due to space constraints.

