Figure 5.
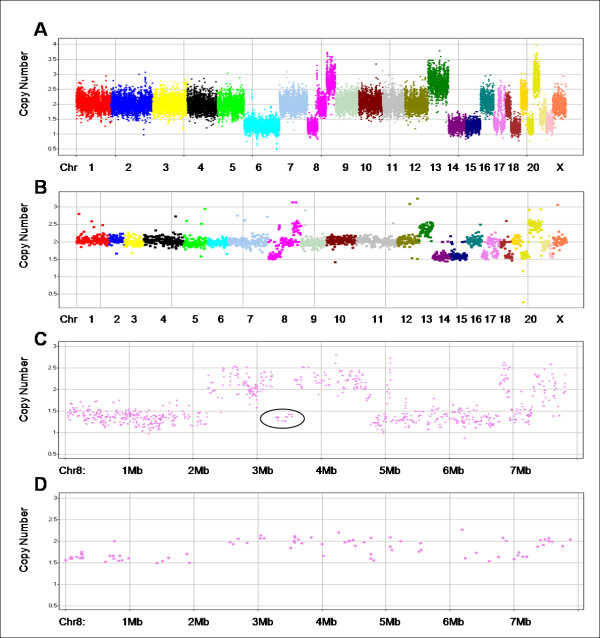
Comparison of MIP and BAC CN results from the same tumor as shown in figure 4. Markers are arranged along the chromosomes and colored by chromosome. Chromosomes are typically labeled; some of the smaller chromosomes are unlabeled due to space constraints. (A) shows the MIP data for the FFPE sample in figure 4B after smoothing (simple 3 marker median) and (B) shows the BAC data. (The two panels are on different X-axis scales because of differences in marker densities. However the panels use the same chromosome color coding scheme to facilitate comparisons. Differences in chromosome 6 are like those seen in figure 4 and, as we discuss in the text, likely due to tumor heterogeneity.) The next two panels show chromosome 17 MIP (C) and BAC (D) data. (These two panels share the same scale on the x-axis.) Some of the fine structure seen in the MIP data is missing in the BAC data, potentially due to resolution differences or genetic heterogeneity: an example is circled.

