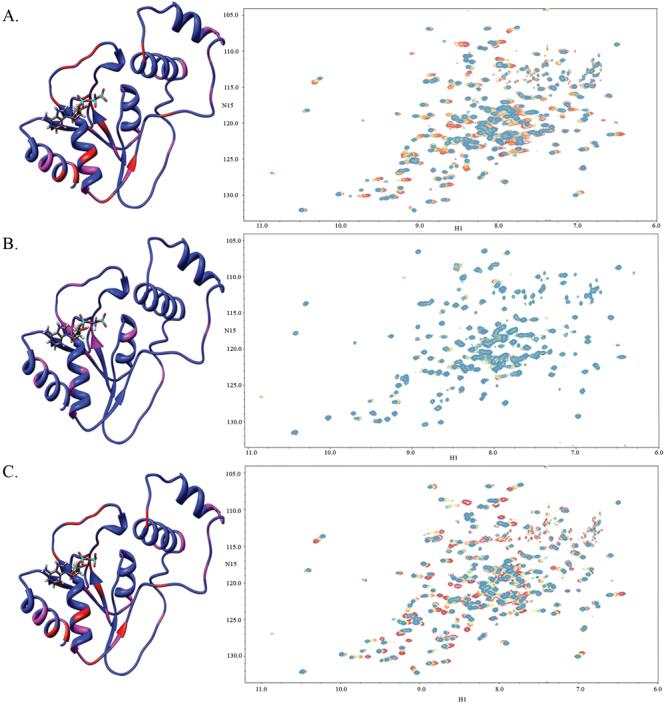
Figure 3.

Chemical shift perturbations due to binding of nucleotides a) Mg-ATP titrated to saturation onto Apo-PMK, b) Mg-AMP-PNP titrated to saturation onto Apo-PMK, and c) Mg-ADP titrated to saturation onto Apo-PMK. All experiments begin at the red cross-peaks, with additions in 100 μM increments to saturation, which is indicated by the transition to the blue cross-peaks. The corresponding chemical shifts are mapped on to the human PMK homology model, where the red indicates a large chemical shift change (>0.09 ppm) and pink indicates a medium chemical shift change (0.05-0.09 ppm), while blue indicates a small or no chemical shift change (or no data).
