
Figure 6.
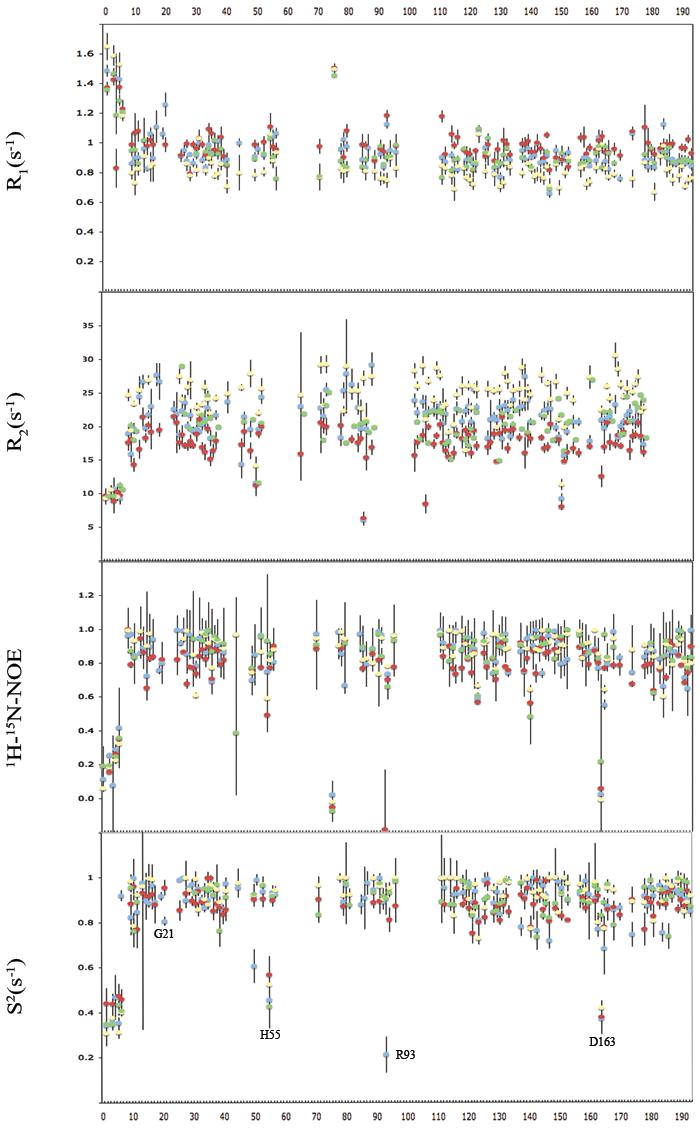
NMR dynamics data including R1, R2, NOE, and S2 values, where blue is the Apo-PMK complex, red is the M5P saturated complex, yellow is the Mg-ADP saturated complex, and green is the ternary complex.
Official websites use .gov
A
.gov website belongs to an official
government organization in the United States.
Secure .gov websites use HTTPS
A lock (
) or https:// means you've safely
connected to the .gov website. Share sensitive
information only on official, secure websites.
NMR dynamics data including R1, R2, NOE, and S2 values, where blue is the Apo-PMK complex, red is the M5P saturated complex, yellow is the Mg-ADP saturated complex, and green is the ternary complex.