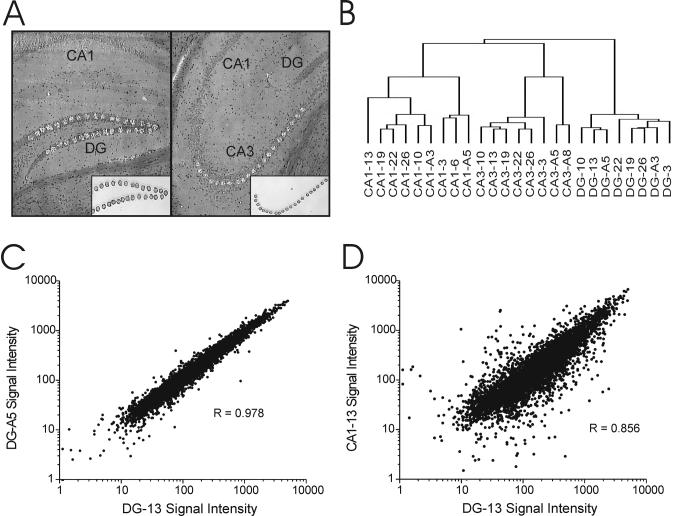
Figure 1. Differential gene expression between hippocampal cell layers.
A. Photomicrographs depicting coronal hippocampal sections after LCM of DG granule neurons (left) and CA3 pyramidal neurons (right). Corresponding inserts show isolated neuronal layers. B. Unsupervised hierarchical clustering using all expressed genes differentiates the three main hippocampal cell layers based on gene expression profile alone. C. Close correlation of gene expression between two DG samples, despite the fact that they are from two different animals from different sacrifice days. D. Lower correlation between DG and CA1 samples from the same animal.

