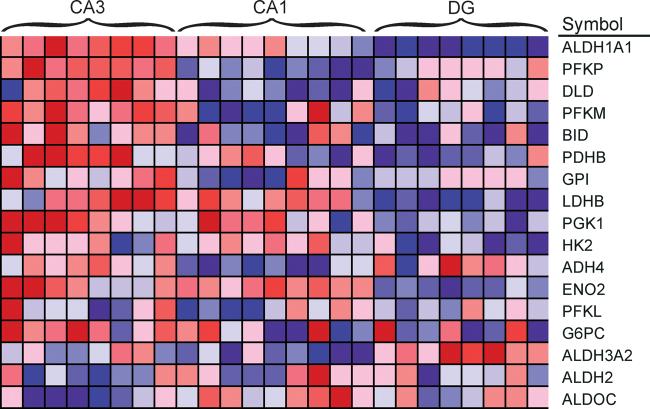
Figure 3. Higher expression of glycolytic genes in CA3 pyramidal cells.
Each cell in the heatmap represents the expression level of a gene (row) in a single sample (column). N=8 for both DG and CA3 samples and N=9 for CA1 samples. Deep red reflects higher expression of the transcript, whereas deep blue represents lower expression.

