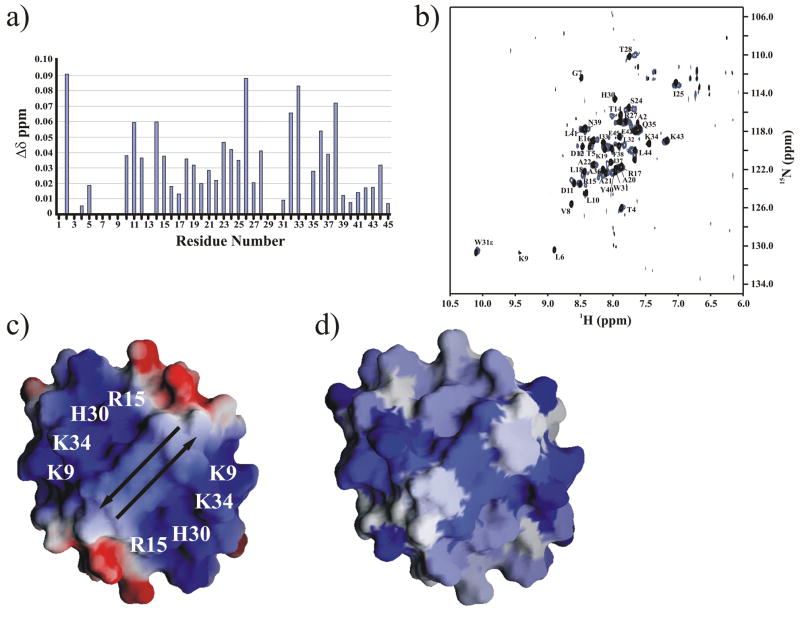
Fig. 4.
a) NH chemical shift differences between the PpPutA45 (85 μM) and PpPutA45:O2-14 DNA (82 μM) complex are plotted against the PpPutA45 sequence. b) Comparison of the 2D 1H-15N TROSY HSQC spectra of the free PpPutA45 (black) and PpPutA45 bound to O2-14 (blue). The backbone amide resonances are assigned. c) Electrostatic surface of PpPutA45 was calculated using GRASP 43. The arrows show the direction of the β-sheet. The labeled positively charged residues bind to the DNA major groove. d) GRASP molecular surface of PpPutA45 colored by the NMR chemical shift changes plotted in (a). The intensity of the blue color corresponds to the magnitude of the chemical shift change.

