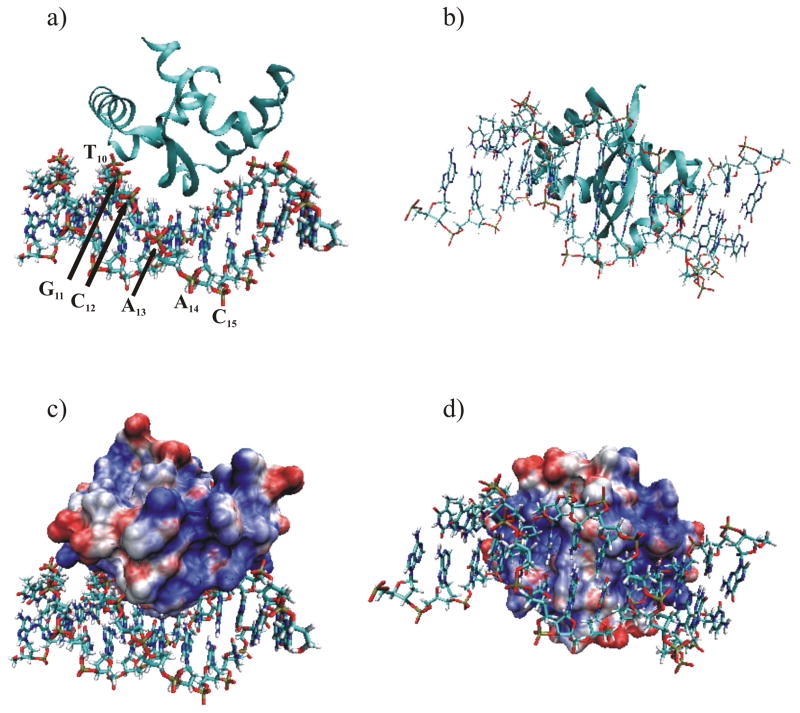
Fig. 5.
Ribbon diagram of the (a) side view and (b) bottom view of the PpPutA45:O2-14 DNA complex. The PpPutA45 β-strand is inserted into the DNA major groove where it interacts with the conserved GTTGCA DNA sequence. The DNA is shown as solid bonds colored by atom-type. (c and d) Electrostatic molecular surface of PpPutA45 calculated using Gemstone and VMD-XPLOR with APBS plugin 44. Basic residues are shown in blue, acidic residues are shown in red, and neutral residues are shown in white. The DNA is shown as solid bonds colored by atom-type. Same view is shown as in (a) and (b), respectively.

