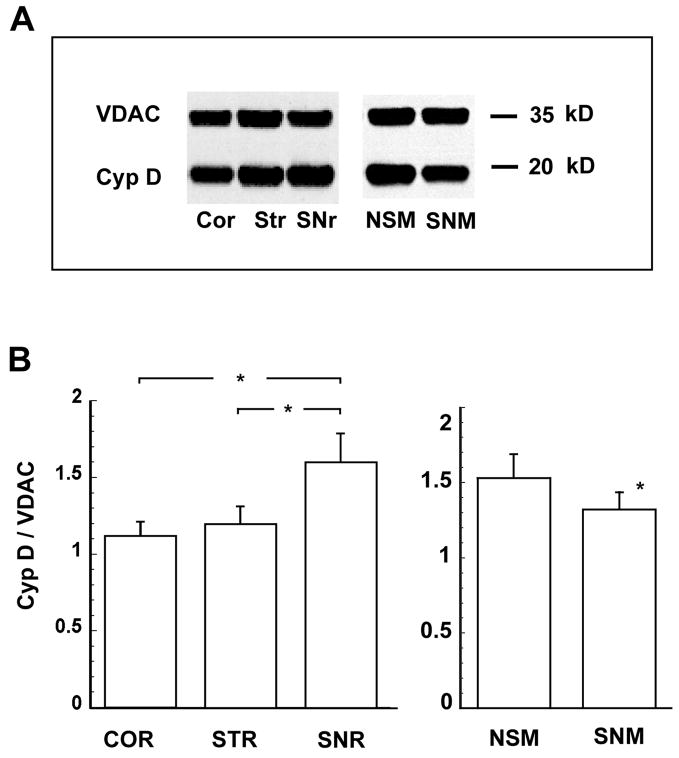
Fig. 3.
Relative distribution of cypD in crude mitochondrial samples from different brain regions and in non-synaptic and synaptic mitochondria. Cyclophilin D immunoreactivity was normalized to the VDAC signal. The normalized immunoreactivity is significantly higher in substantia nigra (SNr) when compared to cortex (Cor) and striatum (Str) (p <0.05, n = 4)(A). Non-synaptic mitochondria (NSM) demonstrated significantly higher levels of cypD when compared to synaptic mitochondria (SNM) (p < 0.05, n = 6) (B).

