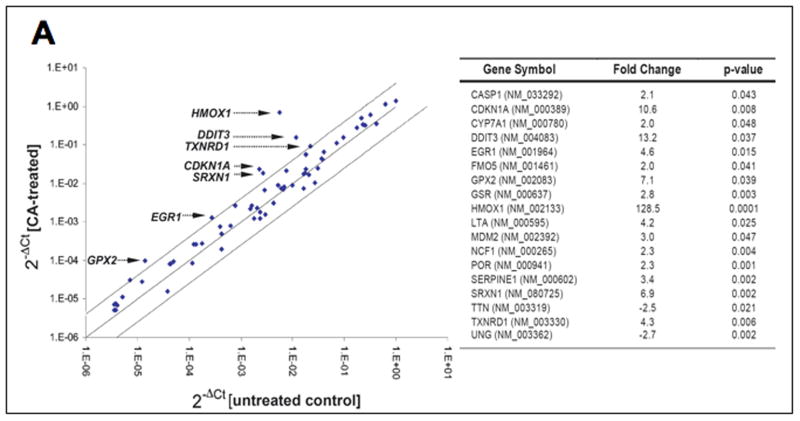
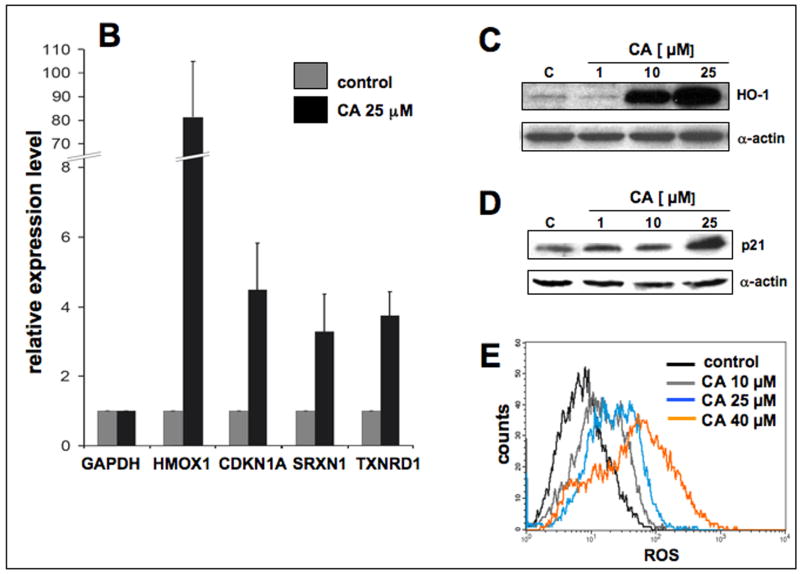
Figure 6. Cinnamic aldehyde induces oxidative stress and oxidative stress response gene expression in human A375 melanoma cells.
(A) CA-induced gene expression changes in A375 human melanoma cells. The scatter blot (left panel) depicts differential gene expression as detected by the RT2 Human Oxidative Stress Profiler™ PCR Expression Array technology profiling the expression of 84 oxidative stress-related genes after CA treatment (25 μM, 24 h; three independent experiments). Upper and lower lines represent the cut-off indicating four fold up- or down-regulated expression, respectively. Arrows specify genes with at least 4 fold up-regulated expression versus untreated controls. The table (right panel) summarizes all genes that are at least two-fold upregulated in response to CA treatment. (B) Human A375 melanoma cells were cultured for 24h in the presence of CA (25 μM) or left untreated. Total RNA was prepared and gene expression of HMOX1, CDKN1A, SRXN1, TXNRD1 was then quantitatively examined using real time RT-PCR analysis with normalization for GAPDH expression levels. Relative expression levels in response to mock treatment (control) and exposure to CA were determined in three repeat experiments (n=3, mean ± SD). (C) CA-modulation of cellular heme oxygenase-1 (HO-1) protein levels and (D) CA-modulation of cellular p21 protein levels were examined in total cellular protein extracts by 15% SDS-PAGE followed by immunoblot detection using enhanced chemiluminescence. Detection of α-actin expression served as a loading control. (E) Induction of intracellular oxidative stress in human A375 melanoma cells by treatment with CA. Cells were exposed to CA (10 and 25 μM, 24 h) and intracellular oxidative stress was assessed by 2′,7′-dichloro-dihydrofluorescein diacetate staining followed by flow cytometric analysis. One representative experiment of three similar repeats is shown. (F) Modulation of intracellular glutathione content in A375 melanoma cells exposed to increasing concentrations of CA (10–40 μM, 24 h). Total glutathione content was normalized to protein content. (G) Upregulation of GCLC gene expression assessed by real time RT-PCR analysis with normalization for β-actin expression levels in A375 melanoma cells exposed to increasing concentrations of CA (10–20 μM, 24 h).


