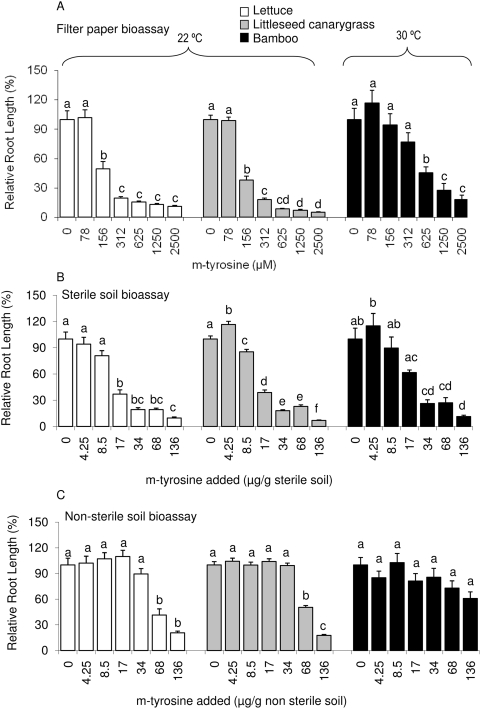
Figure 2. Relative root length (%) of lettuce, littleseed canarygrass and bamboo when exposed to 0, 78, 156, 313, 625, 1250 or 2500 µM m-tyrosine in filter paper bioassays (upper panel), and when grown in sterile (middle panel) or non-sterile (lower panel) soil treated with 0, 4.25, 8.5, 17, 34, 68 or 136 µg m-tyrosine/g soil.
Root length of 3 assay species in soil treated with 0 µg m-tyrosine/g soil is taken as 100%. The root lengths of respective assay species were then calculated relative to the zero level treatment of m-tyrosine. Error bars represent 1 SE and shared letters indicate no significant differences among treatments and control as determined by one-way ANOVA with treatment as fixed variable, and post ANOVA Tukey test (P<0.05).

