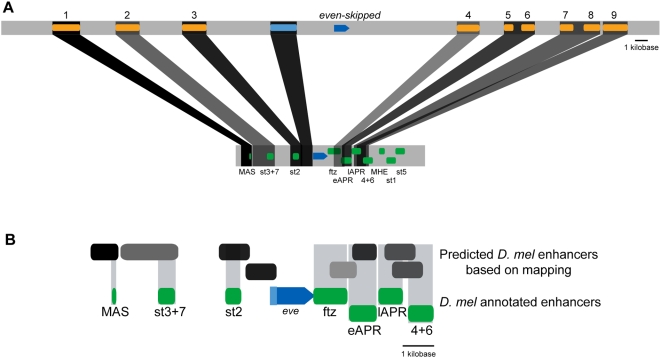
Figure 8. Mapping tephritid eve enhancers to D. melanogaster.
A) Aggregate scoring of short, non-significant BLAST HSP and unique K-mer matches between the C. capitata (top) and D. melanogaster eve loci (bottom) was employed as described above to generate an orthology mapping of non-coding regions flanking the eve gene. Dark grey bars with opacity proportional to relative confidence of mapping link the best match regions between families. Orange annotations in C. capitata, top, indicate the cloned conserved fragments (numbering as employed throughout this work). Green annotations, in D. melanogaster, bottom, are confirmed enhancers drawn from the RedFly database [28], [47] (MAS: eve_mas; st3+7: eve_stripe_3+7; st2: eve_stripe2; ftz: eve_ftz-like; eAPR: eve_early_APR; CQ: eve_CQ/late_APR; 4+6: eve_stripe_4+6; MHE: eve_MHE; st1: eve_stripe1; st5: eve_stripe5). B) Zoom in on D. melanogaster locus showing mapped tephritids CNSs (grey, shading reflects mapping score) and known D. melanogaster enhancers [28] (green).

